The nor’easter that dumped six to eight inches of snow in southeastern Pennsylvania on December 16-17, 2020, provided an excellent opportunity to document stream conductivity response to the application of road salt and deicers to paved surfaces. Collecting grab samples for laboratory analysis of dissolved salts such as sodium (Na+), calcium (Ca++), magnesium (Mg++), and chloride (Cl–), all of which can be toxic to aquatic organisms and can affect drinking water, provided additional data.
Understanding the patterns and timing of road salt and deicers entering local streams is important for providing feedback to local decision-makers, guiding watershed management strategies, and improving and protecting stream health.
As a nonscientist and Penn State Extension Master Watershed Steward (MWS) volunteer, I will focus primarily on describing my strategy and experience during the process of collecting grab samples at five EnviroDIY monitoring station sites in West Chester, Pennsylvania, during and after the storm.
Five Monitoring Stations Transmitting Real-Time Data
The five EnviroDIY Monitoring Stations are all located in the borough of West Chester (see map below), and each is equipped with a sensor that measures conductivity, water temperature, and depth (CTD). The data collected by each monitoring station are transmitted in real time to Monitor My Watershed (MonitorMW). The streams, locations, and data links are as follows:
- Goose Creek at Greenfield Park.
- Plum Run at New Street Garage.
- Plum Run tributary at Gordon Natural Area.
- Blackhorse Run at Buchner Property.
- Taylor Run at the WC Wastewater Treatment plant
The Goose Creek and Plum Run stations are in very urban landscapes located within the borough of West Chester. The station on Plum Run tributary is at the edge of the West Chester University (WCU) campus in the wooded Gordon Natural Area, but it drains large areas of impervious surfaces (e.g., parking lots) of the WCU campus. The Blackhorse Run station is about a mile outside of town, bordering a small horse farm, and the Taylor Run station is just at the edge of town between the 322 Bypass and the Taylor Run wastewater treatment plant.
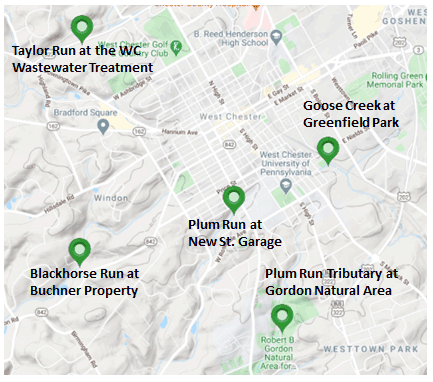
Map of five EnviroDIY Monitoring Stations in the borough of West Chester, Pennsylvania. 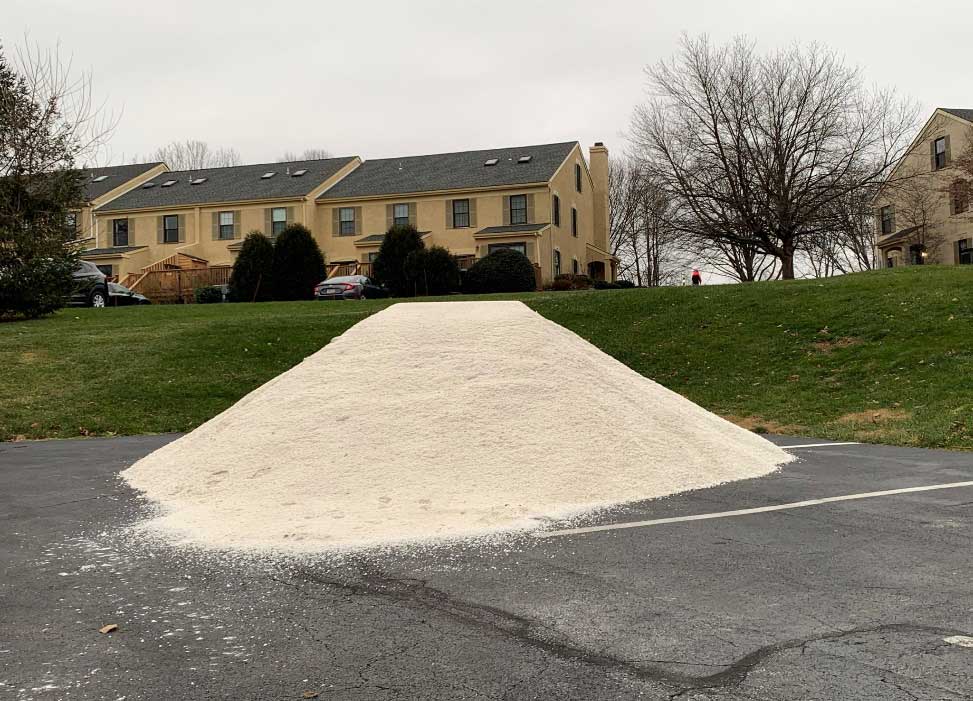
Exposed salt pile before the storm, near a small tributary to Blackhorse Run.
The five stations were installed in November 2019 by Stroud Water Research Center, primarily to collect stream conductivity data for research by the Stroud Center and WCU graduate student and MWS, Patty Haug. I have been helping maintain these five stations in support of Patty’s research for her master’s thesis.
Advance Planning Critical to Achieving Success
Before the storm, Patty and I and the Stroud Center team agreed that we wanted to try to capture multiple grab samples at each of the five sites during and after the storm as runoff from the salted paved surfaces flowed into the streams. Our objective was to collect the samples as close to the top of each stream’s conductivity peak as possible. This was challenging due to our lack of experience with these particular streams’ winter storm conductivity responses since there were no significant winter storms the previous winter (2019-2020). We were familiar with conductivity response for each of the streams during rain events, so we had some knowledge on which streams responded quickly hydrologically and which ones lagged.
Given that there were five sites, each with expected differing conductivity response times, advance planning was critical to achieving success, along with communication and coordination during the storm. Patty and I agreed that we would need to continuously watch the data in real time for each of the five stations using MonitorMW and try to estimate when the conductivity was approaching peak level to trigger our visit to the stream.
Patty and I live within minutes of each other and the five station locations, so getting to the sites quickly to collect grab samples as we saw conductivity rising was no problem. We each had an adequate supply of 1L square Nalgene bottles to collect multiple grab samples from each site.
We agreed Patty would have primary responsibility for sampling Goose Creek, Plum Run, and the unnamed tributary to Plum Run. I would take the Taylor Run and Blackhorse Run sites, and we would assist and cover for each other as needed if multiple streams were spiking at the same time. Fortunately, Patty and I worked together throughout the year, so we had a good working relationship.
The snowstorm started early in the afternoon of December 16, and by 2:50 p.m. I received my first text from Patty saying the conductivity at the Plum Run at New Street station was starting to spike rapidly. It had risen from 1,282 uS/cm (typical base flow conductivity for this stream) at 2:00 p.m. to 2,157 uS/cm at 3:00 p.m. We were both surprised to see the rapid rise so early in the storm since there was little melting and runoff at that point. This station is in near a parking garage, multiple streets, and the large, paved areas of the WCU campus, so any runoff quickly reaches the sensor. (See photo at right.)
Using Real-Time Data to Trigger Sample Collection
We consulted with Dave Bressler and John Jackson at the Stroud Center to get their advice on how to determine when to head out to grab a sample. Both acknowledged the difficulty in predicting the ideal time, so we would have to do our best to estimate and respond according to what the real-time data were telling us. As a rule of thumb, we agreed that doubling of the conductivity was a reasonable minimum benchmark to trigger sample collection.
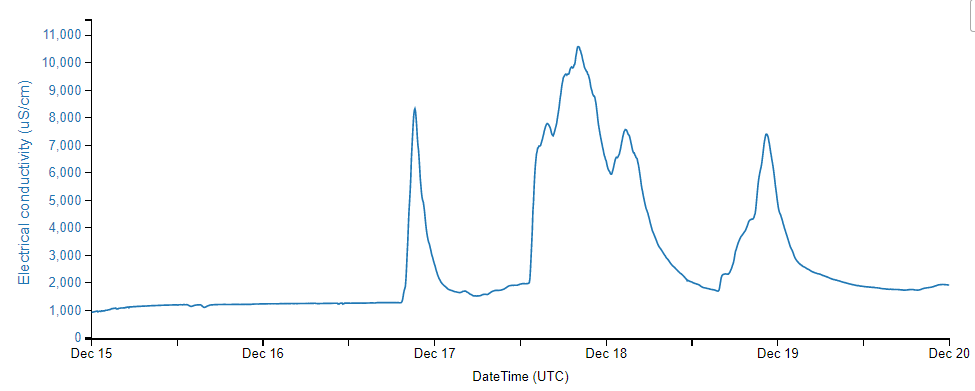
Patty collected the first sample at the Plum Run New Street station at 3:58 p.m. EST on December 16, early in the storm. By that time, within two hours, the conductivity level had skyrocketed to 7,753 uS/cm, almost six times its usual level! The timing of the sample turned out to be ideal, as the level peaked at 4:15 p.m. at 8,328 uS/cm. (Note the first spike in the MonitorMW screenshot below.)
We continued to watch the data on MonitorMW in real-time over the next two days as the snow melted and were able to grab samples near the top of the spikes on December 17 and 18. As you can see below, the second increase began the next morning of December 17 around 8:00 a.m. and continued for most of the day as melting occurred. The third increase on December 18 started around 11:00 a.m. and continued through to late afternoon as the snow melted.
We followed this same process of watching the MonitorMW conductivity data in real time for the other four stations and coordinated with each other, as needed, to collect samples as conductivity levels changed over the next two days of melting. In total, we collected thirteen grab samples from the five sites.
Different Landscapes, Different Responses
It was very interesting to note how differently each stream responded during the same storm. These streams are on adjacent but differing landscapes, causing the timing and intensity of the spikes to vary considerably. The screenshot below from MonitorMW shows each stream’s conductivity response during the storm and following two days of melting. Curiously, Plum Run at New Street Garage was the only stream that had a significant spike so quickly at the very beginning of the storm but spiked more predictably during the melts of the following two days.
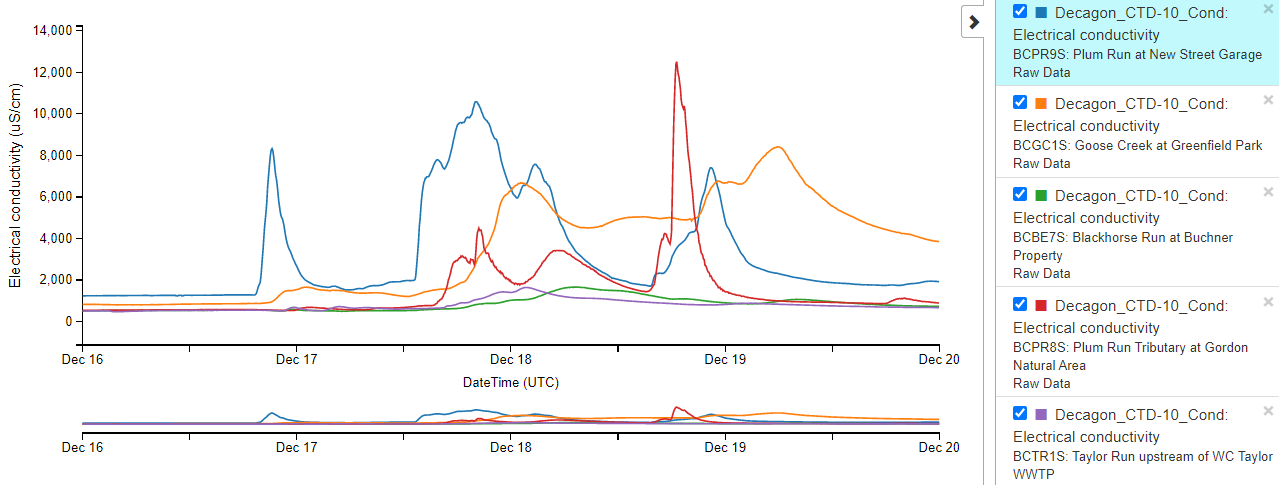
Note the steep spike for Plum Run tributary (red) on December 18. This spike reached a level of 12,514 uS/cm, which is more than 20 times this stream’s typical baseline conductivity. I happened to be there collecting a sample as that peak was occurring. As I was collecting the sample, WCU was plowing and clearing snow on the stadium parking lots just upstream of the station. The sun was shining brightly that afternoon, causing significant melting and runoff directly into the storm sewers in the parking lots, which empty into the stream just upstream of the station, causing huge amounts of salt to flow directly into the stream.
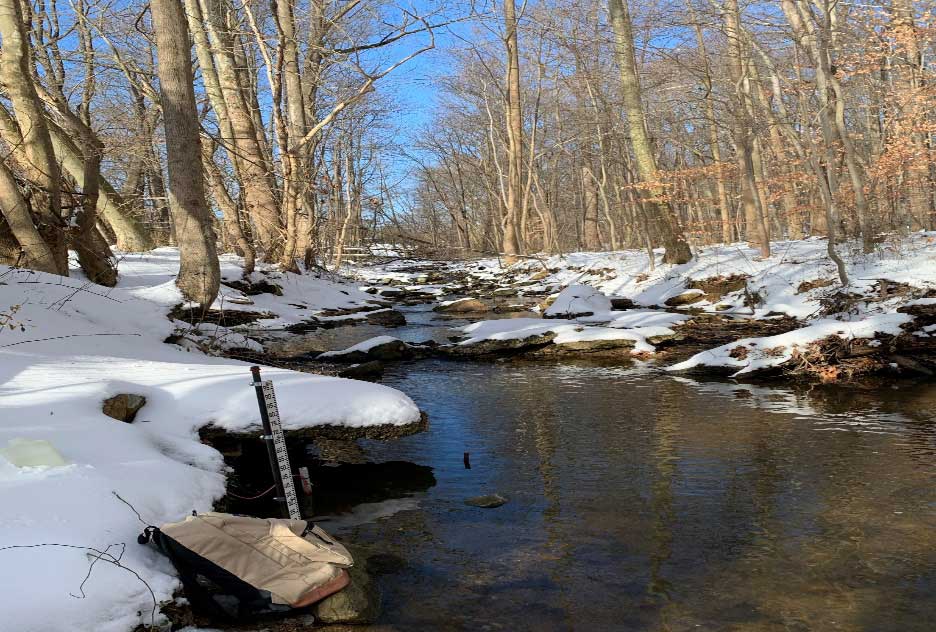
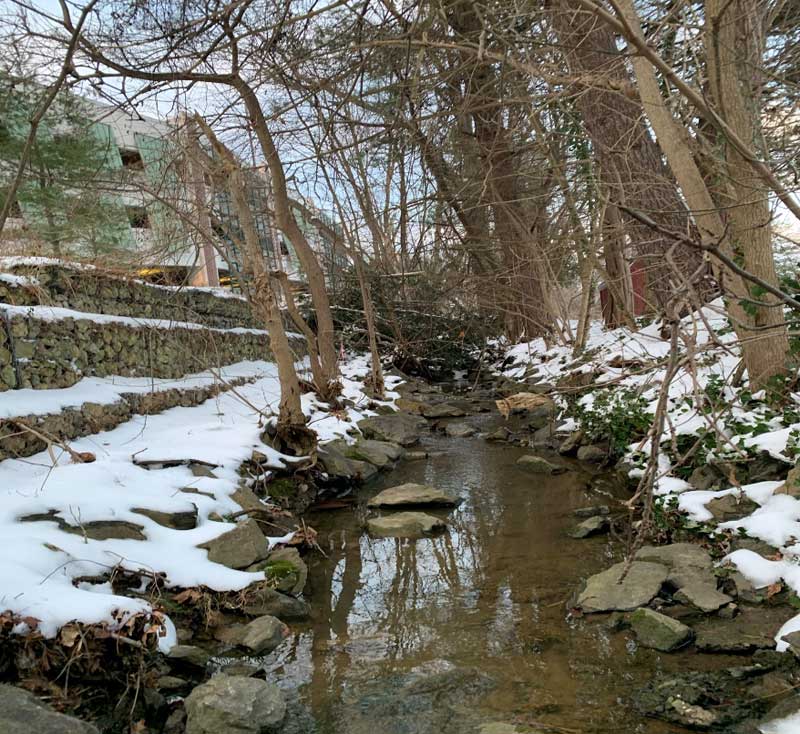
Tributary of Plum Run at Gordon Natural Area, upstream view from the monitoring station. 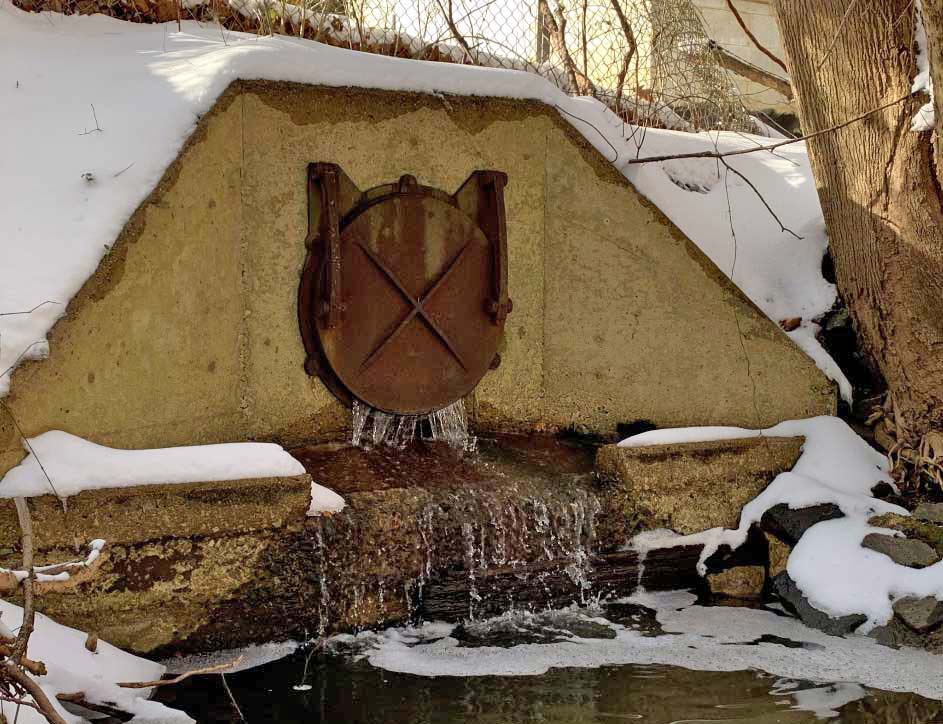
Outfall just upstream from Plum Run tributary, showing runoff from parking lot during conductivity spike.
This sample collection process ended up being very successful due to our advanced planning and coordinated efforts. Because we paid close attention to the timing and duration of events, it also keyed us into the subtleties and variations among the streams of West Chester and their watersheds.
The Stroud Center is currently analyzing the grab samples. Results will be used to determine the content and distribution of salt and deicers in these streams, the potential toxicity to aquatic organisms, and the risk to local drinking water supplies. Patty Haug, who completed her master’s work at WCU in December 2020, will incorporate these data into her analyses and be in communication with WCU and West Chester borough administrators and managers.
I have no background in science, and before joining the Penn State Extension MWS program in 2018, I had no familiarity with the concept of citizen science. I had only a rudimentary knowledge of watersheds, and I certainly had no previous experience in any work that required adherence to scientific principles and procedures. Through my MWS and Stroud Center’s EnviroDIY training and volunteer experience, I have not only increased my knowledge and awareness of local watersheds and related science, but I have gained much experience. I have come to appreciate the power of citizen science and how dedicated nonscientist volunteers can help expand science capacity in support of water quality and stream restoration efforts.
A Few Words from Patty Haug
I knew very little about watersheds before becoming a Master Watershed Steward. When I began volunteering as part of the Delaware Basin EnviroDIY network, I couldn’t have imagined how many different experiences I’d be participating in. Being a graduate student in geoscience at West Chester University ultimately lead me to my current level of involvement with citizen science.
The five West Chester streams describe here by George were the topic of my graduate project. This experience required and encouraged me to begin new conversations with university departments, township officials, and fellow students. Additionally, I’ve learned to collect discharge measurements using a flowmeter and other measurement techniques and am now collecting grab samples for analysis.
These are all offshoots that began from the commitment to station maintenance and operation. It’s amazing to realize citizen science has no limits.
About the author: George Seeds is a Penn State Extension Master Watershed Steward in Chester County, Pennsylvania.
We welcome Manage My Watershed members to share their thoughts using the comment form below. Not a member? Register or show your appreciation with the “Like” button. And if you have a watershed story to tell, please share it with our community!
